|
QUASES-Tougaard (developed by Sven Tougaard) |
|
|
||||
|
The QUASES-Tougaard software is for accurate determination of the structure and composition of nano-structures on surfaces. The information is obtained from analysis of both the peak intensity and the background of inelastically scattered electrons. The software builds on the fact that the XPS peak shape depends on the surface structure of the solid on the nano-meter depth scale. By proper analysis of the peak intensity and shape, the quantitative composition of the surface can therefore be determined. The software package provides all the necessary tools needed to do the analysis. |
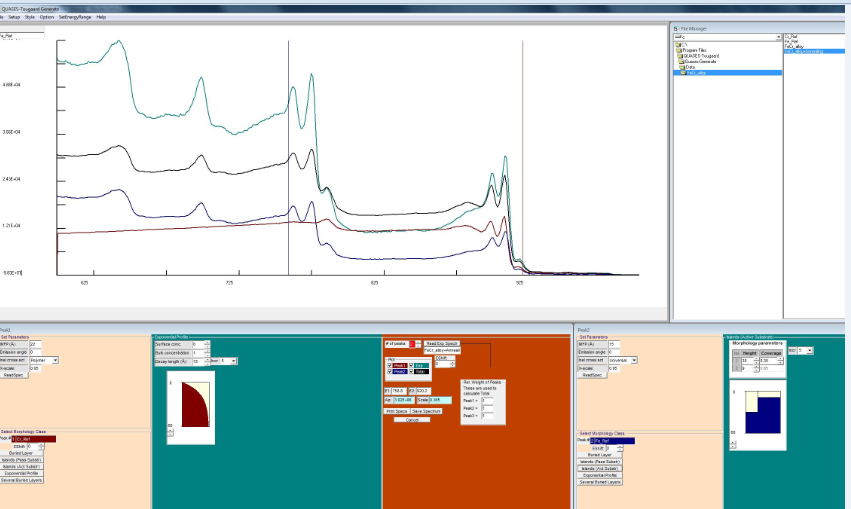
Menu Driven Graphical User InterfaceThe software has a menu driven graphical user interface which allows the user to interactively perform the analysis of the spectrum by changing the surface structure. A graphical representation of the assumed in-depth composition profile as well as the resulting spectrum calculated for this profile are displayed simultaneously on the screen together with the measured spectrum. It includes programs that determine the background corrected spectrum corresponding to the spectrum from a single atom as well as programs to calculate a model spectrum corresponding to a user specified in-depth concentration profile.
|
|||||
|
|
|
|
|
|
||
|
The problem with traditional XPS analysis.
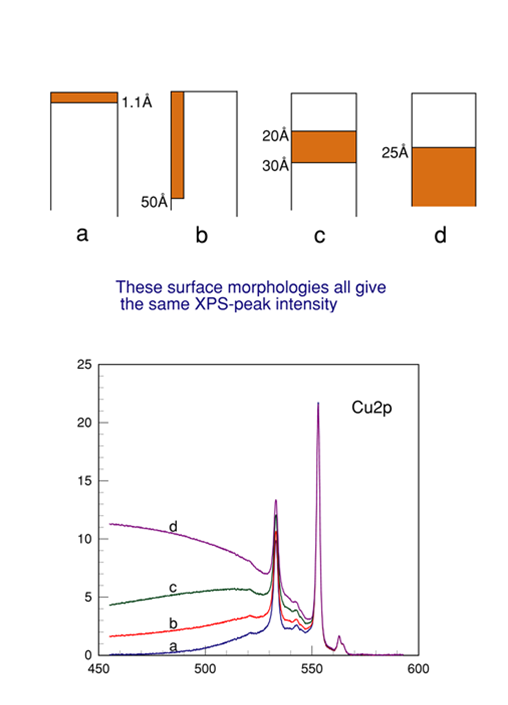
The situation is illustrated in the figure. The four quite different distributions of Cu in Au give exactly the same peak intensity because the intensity is attenuated with the distance travelled. As a consequence the peak intensity carries very limited quantitative information. The electrons in the four situations have travelled different distances in the solid before they exit the solid surface and consequently the enegy distribution will vary. With all Cu atoms in a surface thin layer, as in a) very few electrons will lose energy and the peak intensity is high and the background low. With all Cu atoms at large depths as in d) most electrons will have lost energy and are taken away from the peak-energy and end up in the background at lower energies. Therefore the background of inelastically scattered electrons varies strongly.The detailed variation in peak shape as in a), b), c), and d) reflect the difference in nano-structure. With a proper analysis of these effects it is possible to determine the morphology. This is what is done in the QUASES-Tougaard software. |
The QUASES Software Package comes complete with full documentation, including a comprehensive user manual. The software runs under Windows.
The software package includes facilities for
|
|


